


Animation for the Bus Suspension Example
Contents
Purpose
The purpose of this Graphical User Interface (GUI) is to allow the user to view an animation of the Bus Suspension system with the step disturbance response plot. This allows the user to see the correlation between the plot and the system's physical response.
The animation and GUI are based on the Bus Suspension: Root Locus Controller Design example. For more information on the system model please refer to the Bus Suspension: System Modeling page.
Running the GUI
To run the GUI you will need 2 files. Copy each of them to the directory in which you are running MATLAB.
busgui.fig - contains the graphical interface.
busgui.m - contains the GUI callback function.
Once these files are copied into your MATLAB directory, simply enter the following command:
busgui
The other file need not be run from the command window, it will be called separately by the GUI. One window will appear on your screen after the command has been executed. It will look like the one given below once you move the Gain bar a bit.

Using the GUI
Below are descriptions of each of the controls found in the GUI. These descriptions are intended to give the user a better understanding of what each control actually does. However, feel free to experiment with the controls and use this section as a reference for any questions you might have.
The first group of controls contains the Start, Reset and Exit buttons. These controls perform most of the work in the GUI.
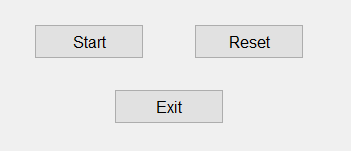
Start - This button performs the simulation, plots the response in the upper-right portion of the window and runs the animation in the lower-right portion of the window.
Reset - This button clears the upper-right step response plot and sets the bus model to its initial position. If a plot is not cleared, the next run will be graphed on the same plot. This is useful if you want to graphically see the effect of varying a parameter.
Exit - This button closes the GUI.
An example of the animation and response plot are shown below. It should be noted that the bus appears with only one wheel because a quarter-bus model was used in our example.


Thne next group of controls contains checkboxes that allow the user to change various features of the GUI.

Manual Advance - If this control is checked, the user is able to advance the animation and plot one frame at a time. The frames are advanced by pressing any key on the keyboard. This function is useful if the animation moves too fast for the user and will allow the user to better visualize the entirety of the system's motion.
Plot Separately - By checking this box the step response plot is graphed in its entirety before the animation is run.
This control shown below allows you to select the gain of the controller.

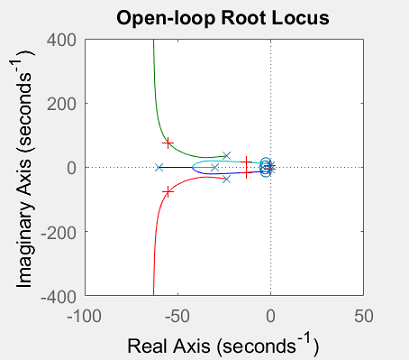
Gain Slider - The slider allows you to change the controller gain, thereby changing the open-loop pole locations. The open-loop root locus can be viewed in the lower-left corner of the GUI. Changing the gain will change the pole locations in the root locus. You can click on the arrows to move the slider, grab the slider bar and move it, or click on the slider to change the gain. The current value of the gain is displayed in the upper portion of the box.
An example of the root locus plot is shown below. The red cross marks (+) represent the pole locations corresponding to the selected gain.
Remember, this GUI is intended to be an interactive learning tool that will allow the user to get a feeling for how some basic control techniques and ideas are represented in the real world. Therefore, the user is encouraged to play around with this tool to enhance their understanding of controls.
